
If you’re a USENET user then there’s a good chance that you love data too. The growth of the USENET feed over the last decade is very interesting and shows all sorts of changes in user behavior, the quality of our internet connections, and much more.
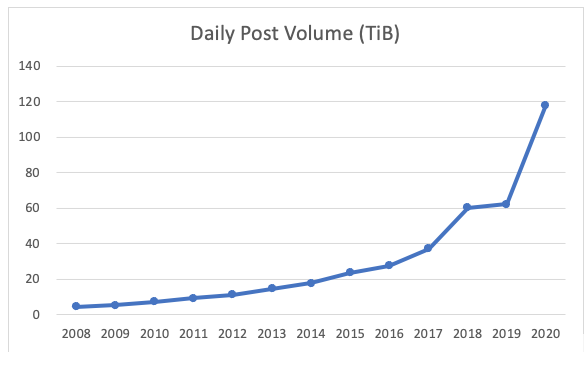
The approximate volume of USENET data generated in 2008 was 4.7 TB per day, which was a staggering amount at the time. The USENET feed has grown around 25% yearly since 2008 and now sits at around 120 TB per day, a 5X increase. Another way to look at this… 2020 alone accounts for nearly 30% of the total USENET data since 2008, and we’re not half-way through the year.
Just like most things digital, USENET newsgroups have grown substantially and quickly. What once took a year to achieve is now a bi-weekly milestone. Since 2008, online users have increased by more than 1,157 times with an estimated 4.79 billion people spending an average of 6.5 hours online every day.
Older Data is Becoming Less Important
One potential explanation for the growth of the USENET feed is reposting. Older articles are increasingly being reposted, which pushes more of the total USENET feed into the more recent days.
It’s estimated that only 10% of articles posted are ever actually read and more than 50% of the articles read are less than 120 days old and a whopping 85% of the read articles are less than 1500 days old. Combine that with reposting and the growth of the USENET feed makes more sense. Older articles are just not pulled as often.
Retention is a Poor Metric
Since older articles no longer carry the weight that they used to it doesn’t make sense to hold up binary retention as the most important metric in Usenet anymore. The vast majority of read articles are from within the last 12 months or so, and that’s where our focus is and where we have put our primary resources into technology to deliver those articles as fast as possible. NGD’s primary goal is to make sure that our users have the fastest access to the articles they need. We show less than 1.5% of all requested articles are unavailable, and those are typically par2 files. This number includes all message failures including articles outside our retention as well as articles that have been deleted or removed.
What’s Next?
Due to a number of factors, especially those that have been created through our worldwide pandemic, it’s too soon to say what the daily volume total could be for 2021. As of now though, the forecast for it should only see a positive increase in these numbers.